Customers
Understand Your Customer Journey and Behavior
The Customers section in Growify helps you visualize how users interact with your business across different touchpoints.
From first interaction to final conversion, you can track customer journeys, analyze behavior, and gain deeper insights into how your marketing drives results.
What You Can Do in Customers
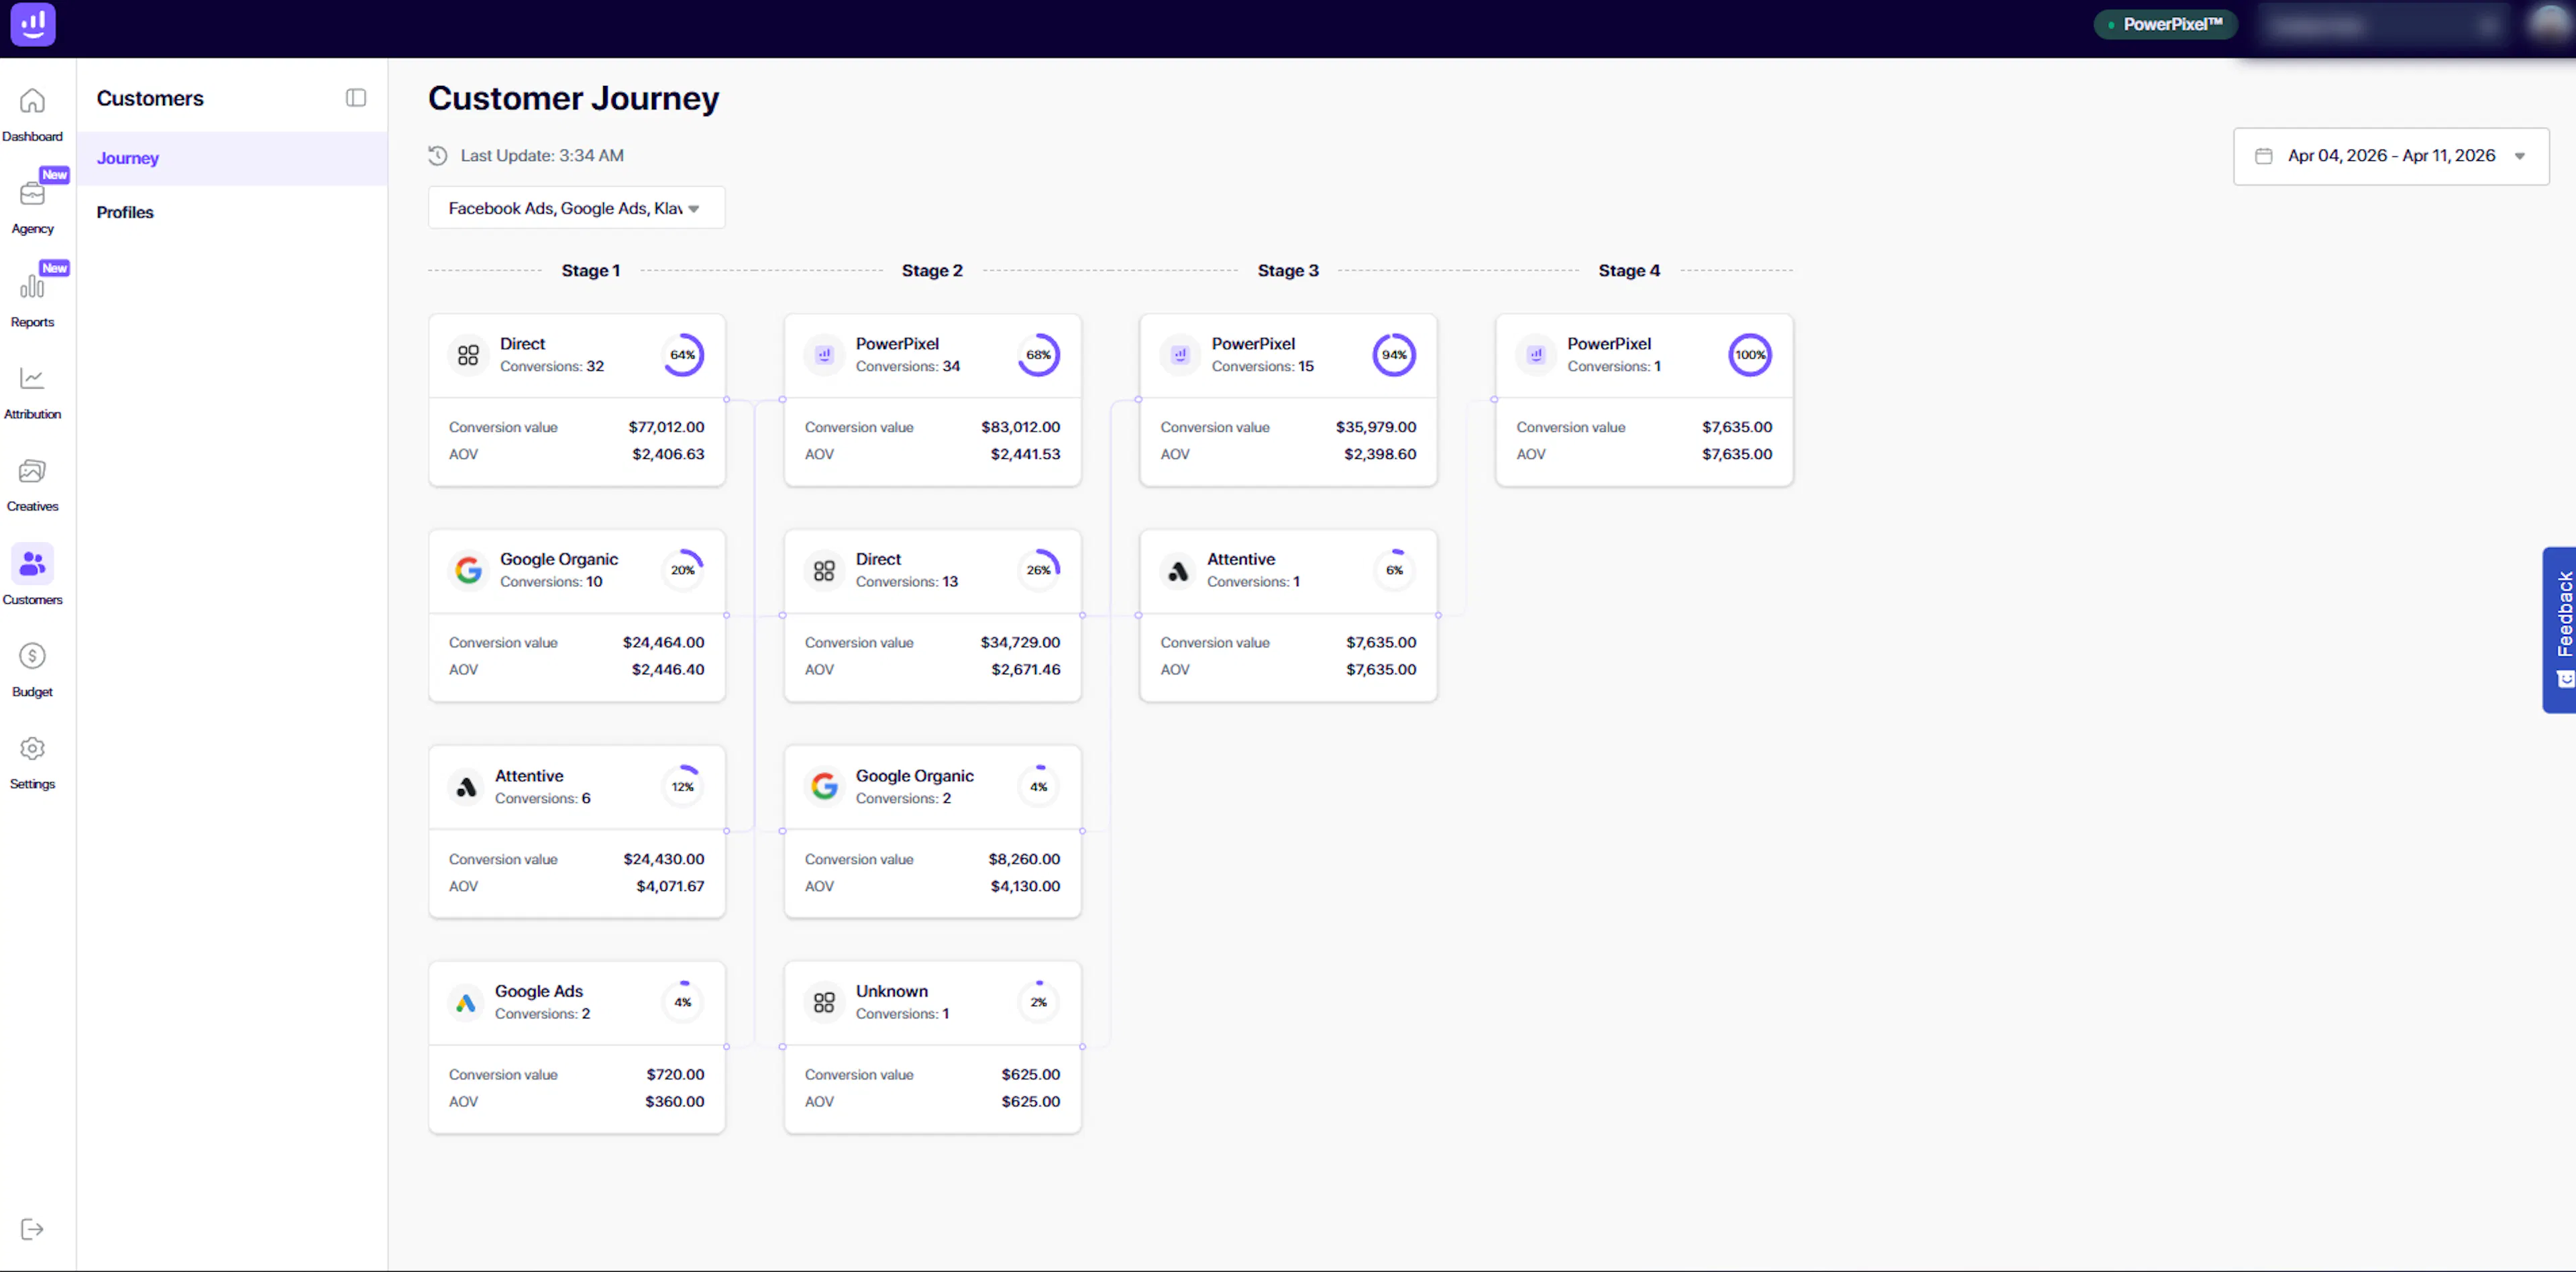
01. Visualize the Customer Journey
The Journey view shows how customers move through different stages before converting.
You can:
-
See multi-step conversion paths
-
Identify key touchpoints (e.g. Direct, Google, Meta, Klaviyo)
-
Understand how channels work together
Each stage represents a step in the journey, showing:
-
Number of conversions
-
Conversion value
-
Average Order Value (AOV)
-
Contribution percentage
This helps you understand not just what converted, but how it converted.
02. Analyze Multi-Touch Behavior
Customers rarely convert from a single interaction.
The Journey view helps you:
-
Identify common paths to conversion
-
Discover supporting channels (not just last click)
-
Understand the role of each touchpoint
This is especially useful for improving attribution and campaign strategy.
03. Track Channel Contribution
See how different acquisition channels contribute at each stage of the journey.
Examples include:
-
Direct
-
Google Organic
-
Google Ads
-
Meta Ads
-
Email (Klaviyo)
-
Other tracked sources
This allows you to evaluate the real impact of each channel across the funnel.
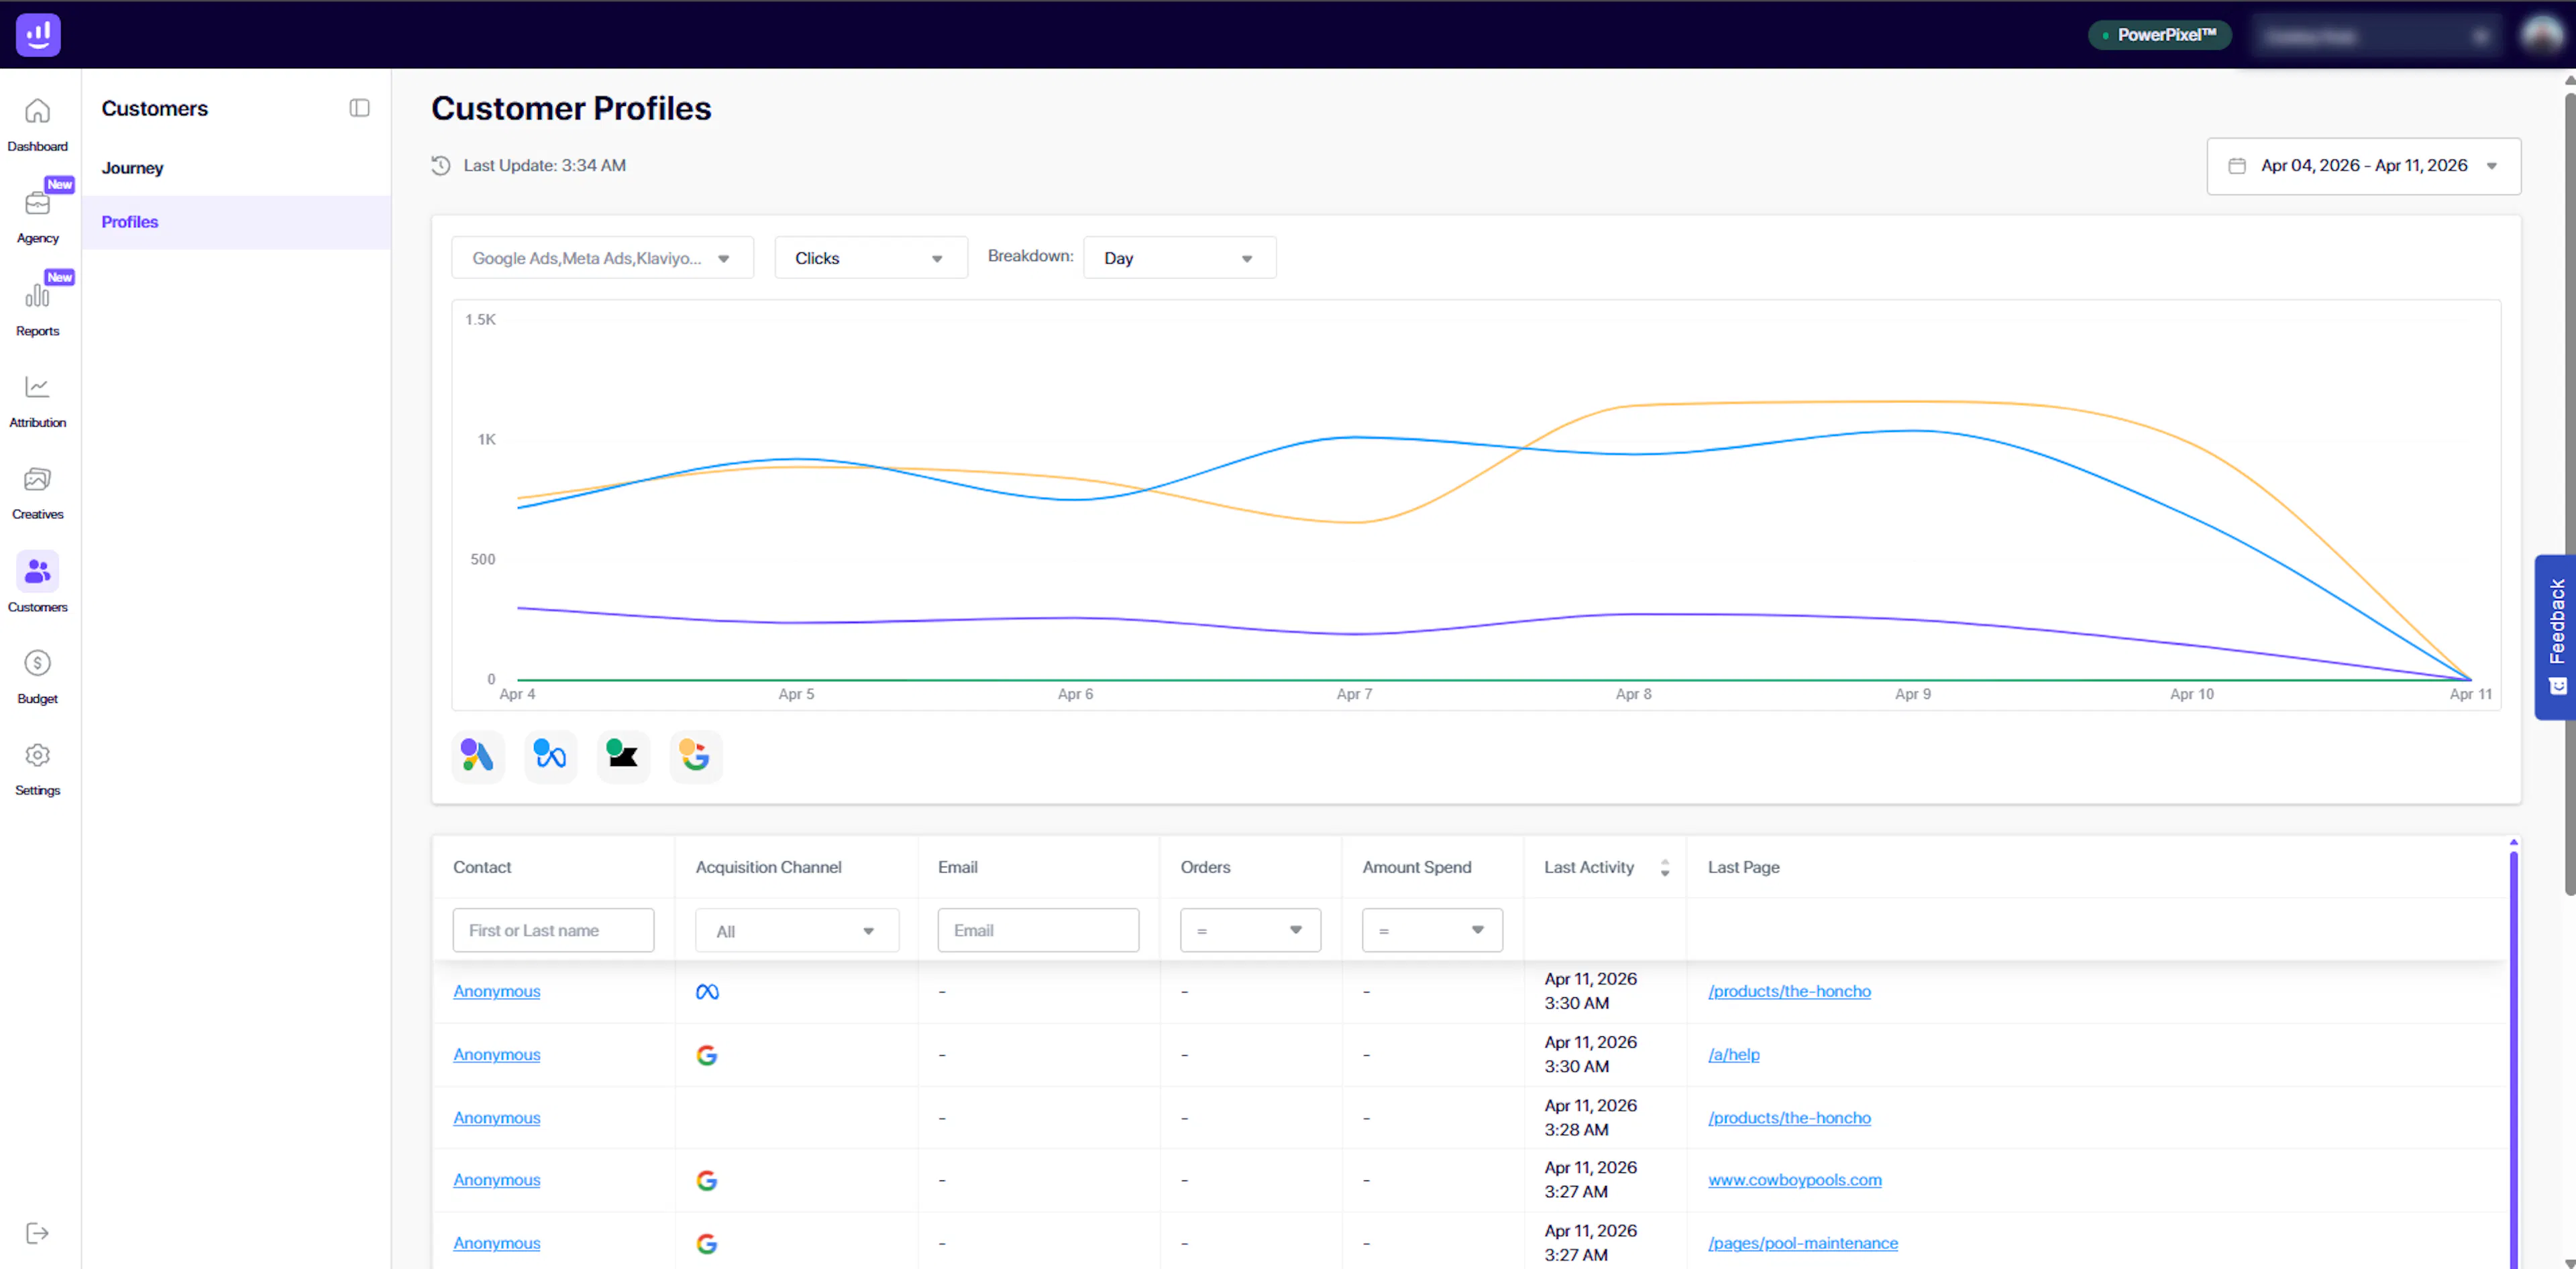
04. Explore Individual Customer Profiles
The Profiles view provides a detailed list of individual users and their activity.
You can view:
-
Contact (or anonymous user)
-
Acquisition channel
-
Email (if available)
-
Number of orders
-
Amount spent
-
Last activity timestamp
-
Last visited page
This gives you a granular understanding of user behavior and engagement.
05. Analyze Behavioral Trends Over Time
Use the chart in the Profiles view to analyze activity trends.
You can:
-
Track clicks and interactions over time
-
Break down data by day
-
Compare performance across channels
This helps you identify engagement patterns and changes in user behavior.
06. Filter and Segment Customer Data
Quickly find and analyze specific users using filters:
-
Search by name or identifier
-
Filter by acquisition channel
-
Filter by orders or spend
-
Narrow down based on activity
This makes it easy to segment your audience for deeper analysis.
07. Work with Anonymous and Identified Users
Growify tracks both:
-
Anonymous users (pre-conversion or no email captured)
-
Identified users (with email or known data)
This ensures you get visibility into the full customer journey, even before a user converts.
How It Works
-
Install the Growify Power Pixel
-
Track user interactions across your website
-
Capture UTM data and channel sources
-
Visualize journeys and user profiles
-
Analyze behavior and optimize your marketing strategy
Why It Matters
Understanding your customers is key to improving performance.
With Growify, you can:
-
See how users actually convert
-
Identify high-impact channels
-
Improve targeting and messaging
-
Optimize the full customer journey
Important Notes
-
Customer data depends on Power Pixel tracking and UTMs
-
Some users may appear as “Anonymous” if no identifying data is captured
-
Journey visualization reflects tracked interactions within the selected time range
Pro Tip
Use Customers together with Attribution and Creatives:
-
Customers → How users behave and convert
-
Attribution → Where conversions are credited
-
Creatives → What content drives engagement
Together, they give you a complete understanding of your marketing performance.
Last updated 4 days ago
Built with Documentation.AI